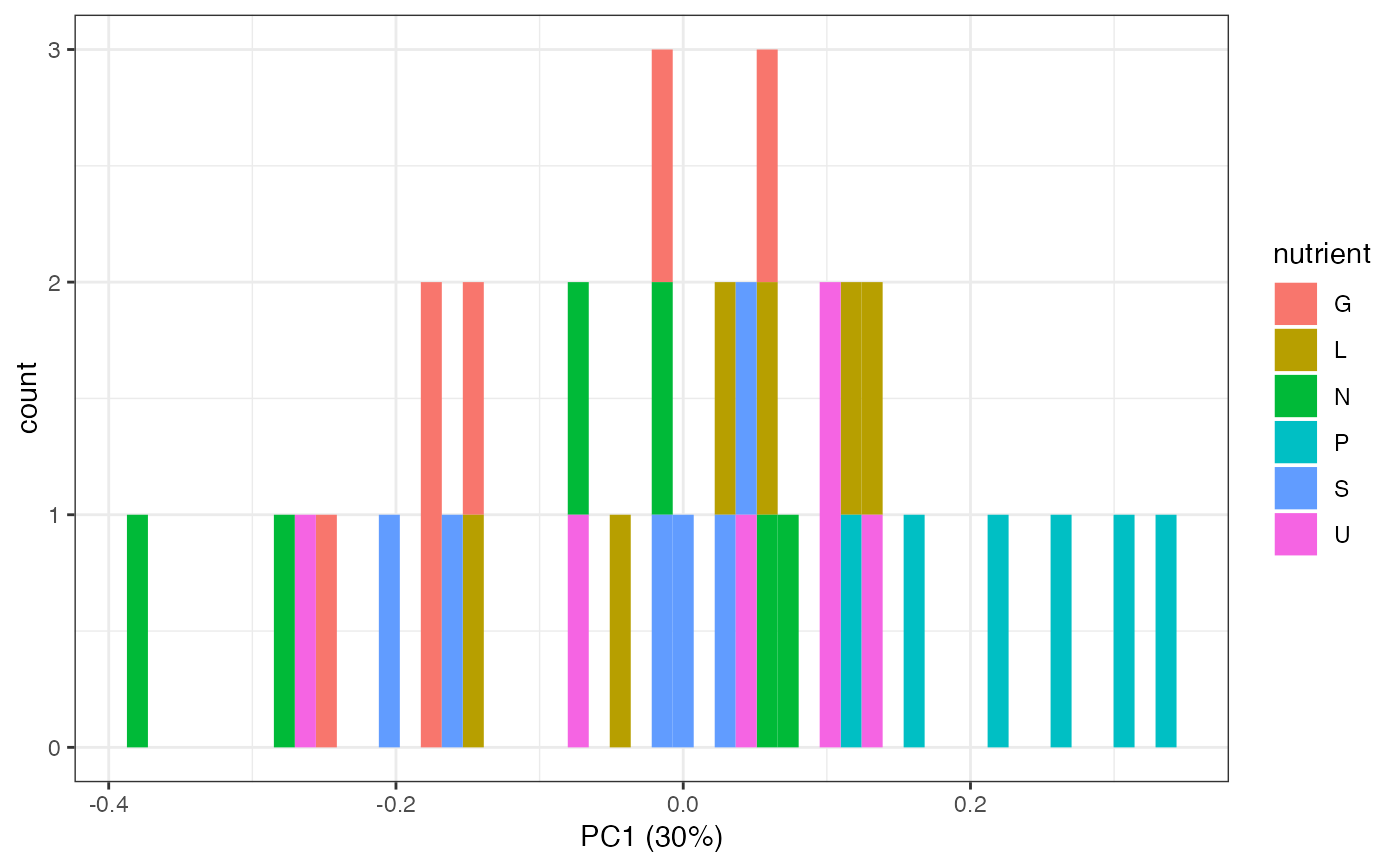
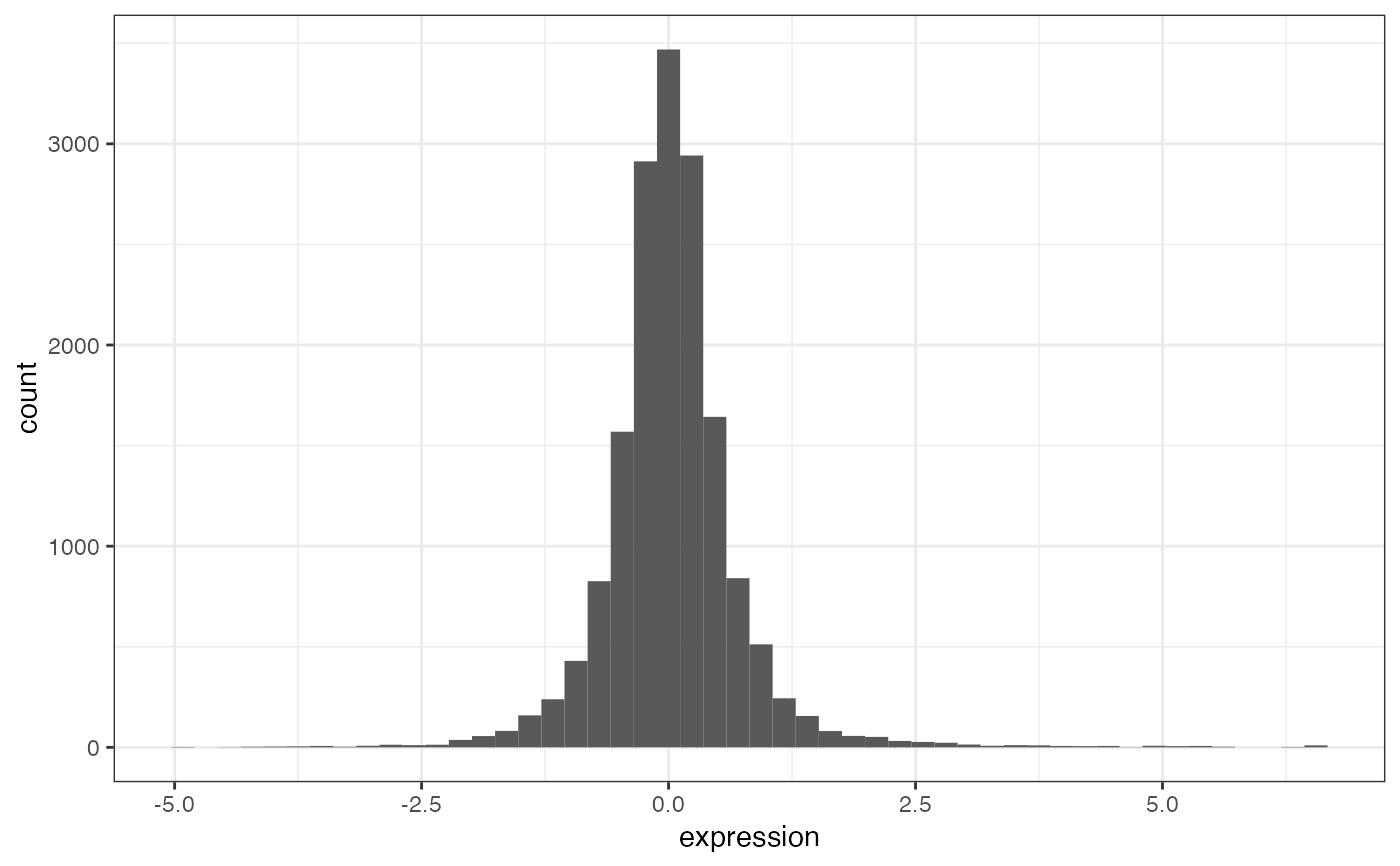
Univariate Plot
plot_univariate.RdCreate a histogram from a tomic dataset.
plot_univariate(tomic_table, x_var, color_var = NULL)Arguments
- tomic_table
A table taken from a tidy (i.e., augmented measurements) or triple omic dataset
- x_var
x-axis variable
- color_var
coloring variable (NULL to suppress coloring)
Value
A ggplot2 grob