P-value Histogram
plot_pvalues.RdP-value Histogram
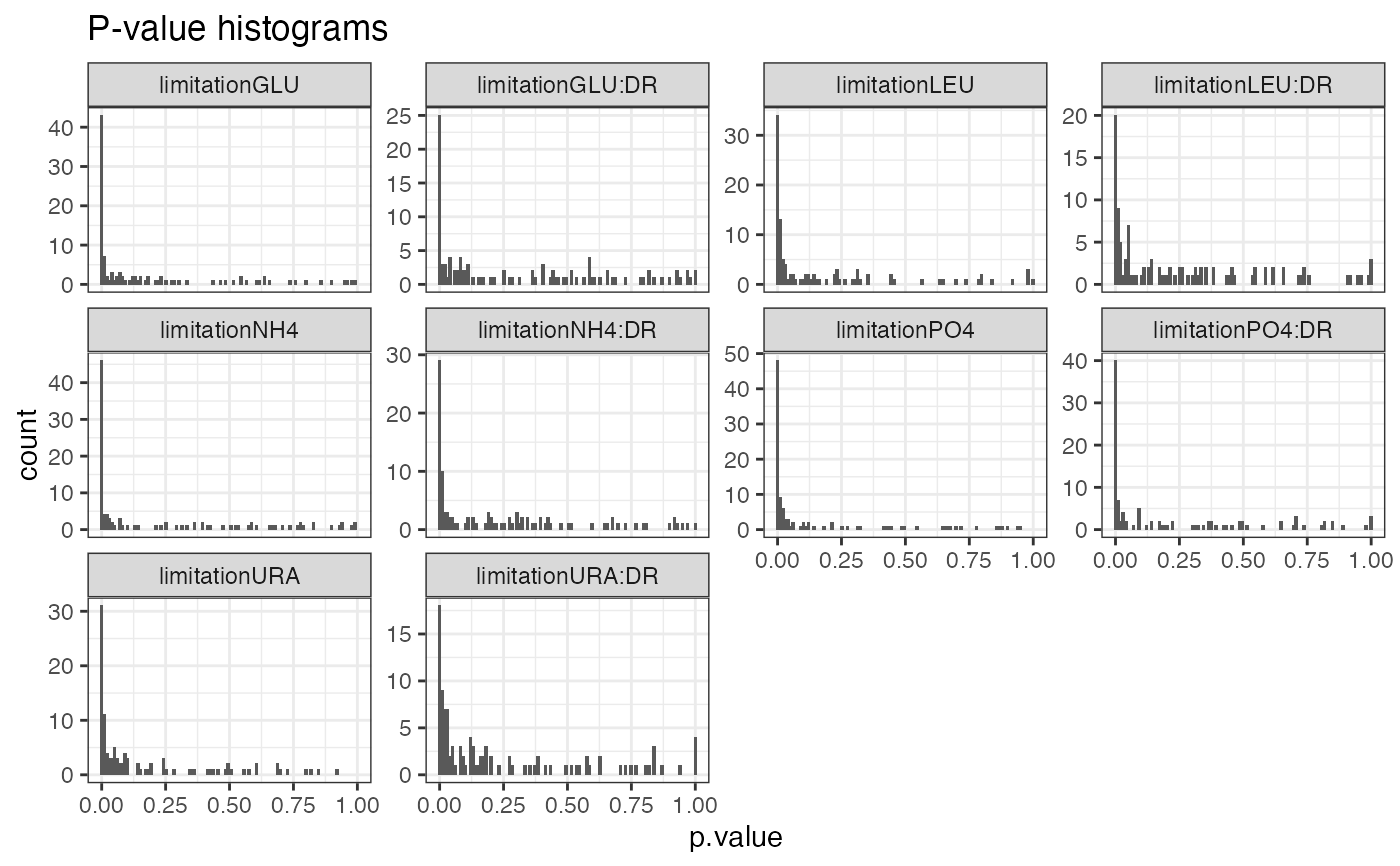
plot_pvalues(regression_significance)
Arguments
| regression_significance | returned by |
|---|
Examples
regression_significance <- diffex_mzroll( nplug_mzroll_normalized, "normalized_log2_abundance", "limitation + limitation:DR + 0" )#> Warning: q-value calculation initially failed due to too many small p-values #> but claman was able to recover resultsplot_pvalues(regression_significance)